01
Databite
2024
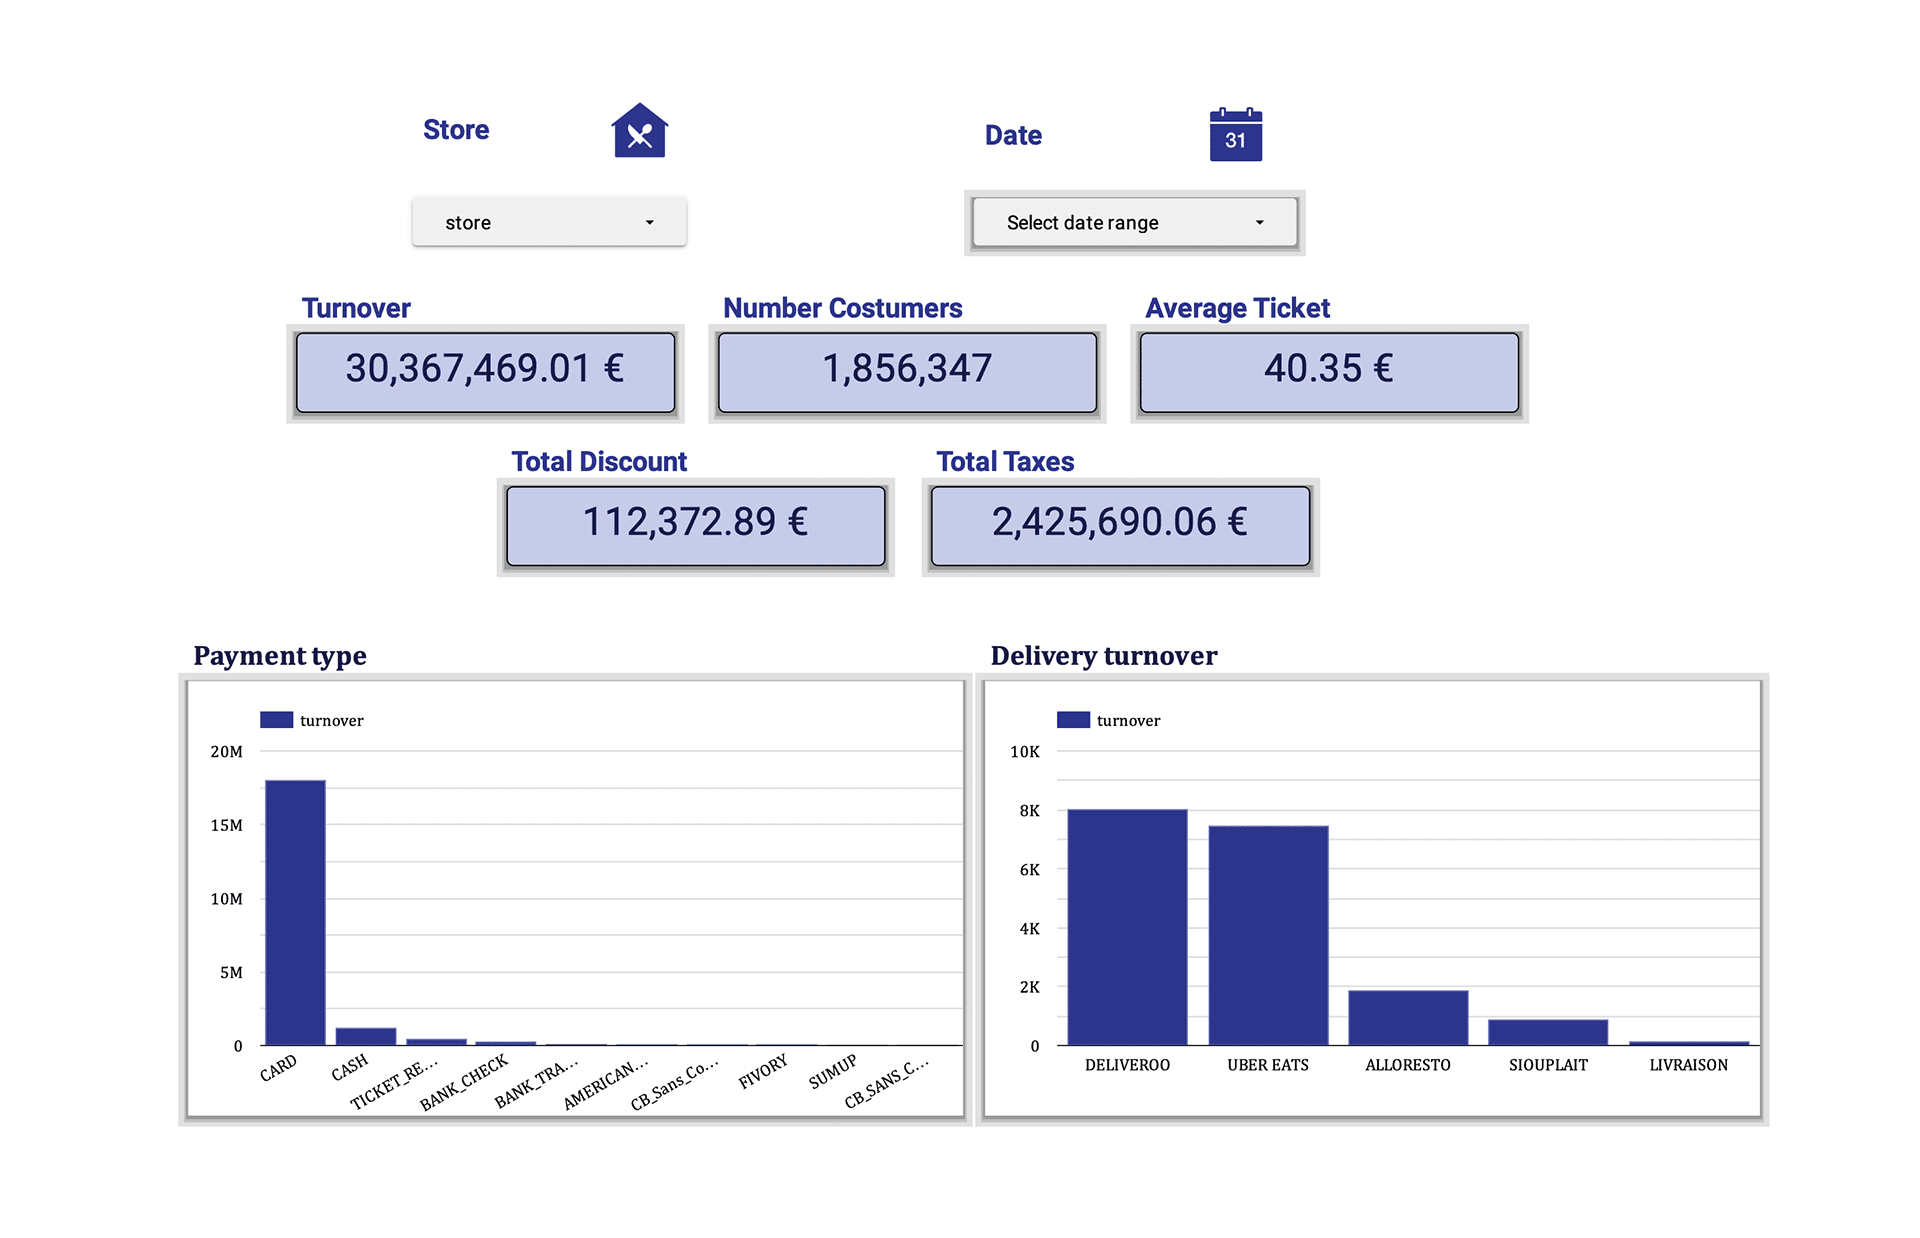
In December of 2024 my colleagues and I created Databite, a project case study combining the power of data analytics with restaurant operations. From small eateries to large chains, data can transform decision-making and we wanted to pitch for prospective clients the power of this dashboard using anonymized data.
The goal was to showcase in a clean and informative way how the data generated from the Databite software can help improve business operations and finances.
02
Process
Databite provides analytics solutions tailored for restaurants, cafeterias and ghost kitchens. By analyzing customer behavior, sales trends, and operational efficiency, Databite empowers businesses to make data-driven decisions that improve performance and optimize resources.
Skills
Data collection & cleaning: gathered real-world datasets (sales, operations, payments) and cleaned them for analysis.
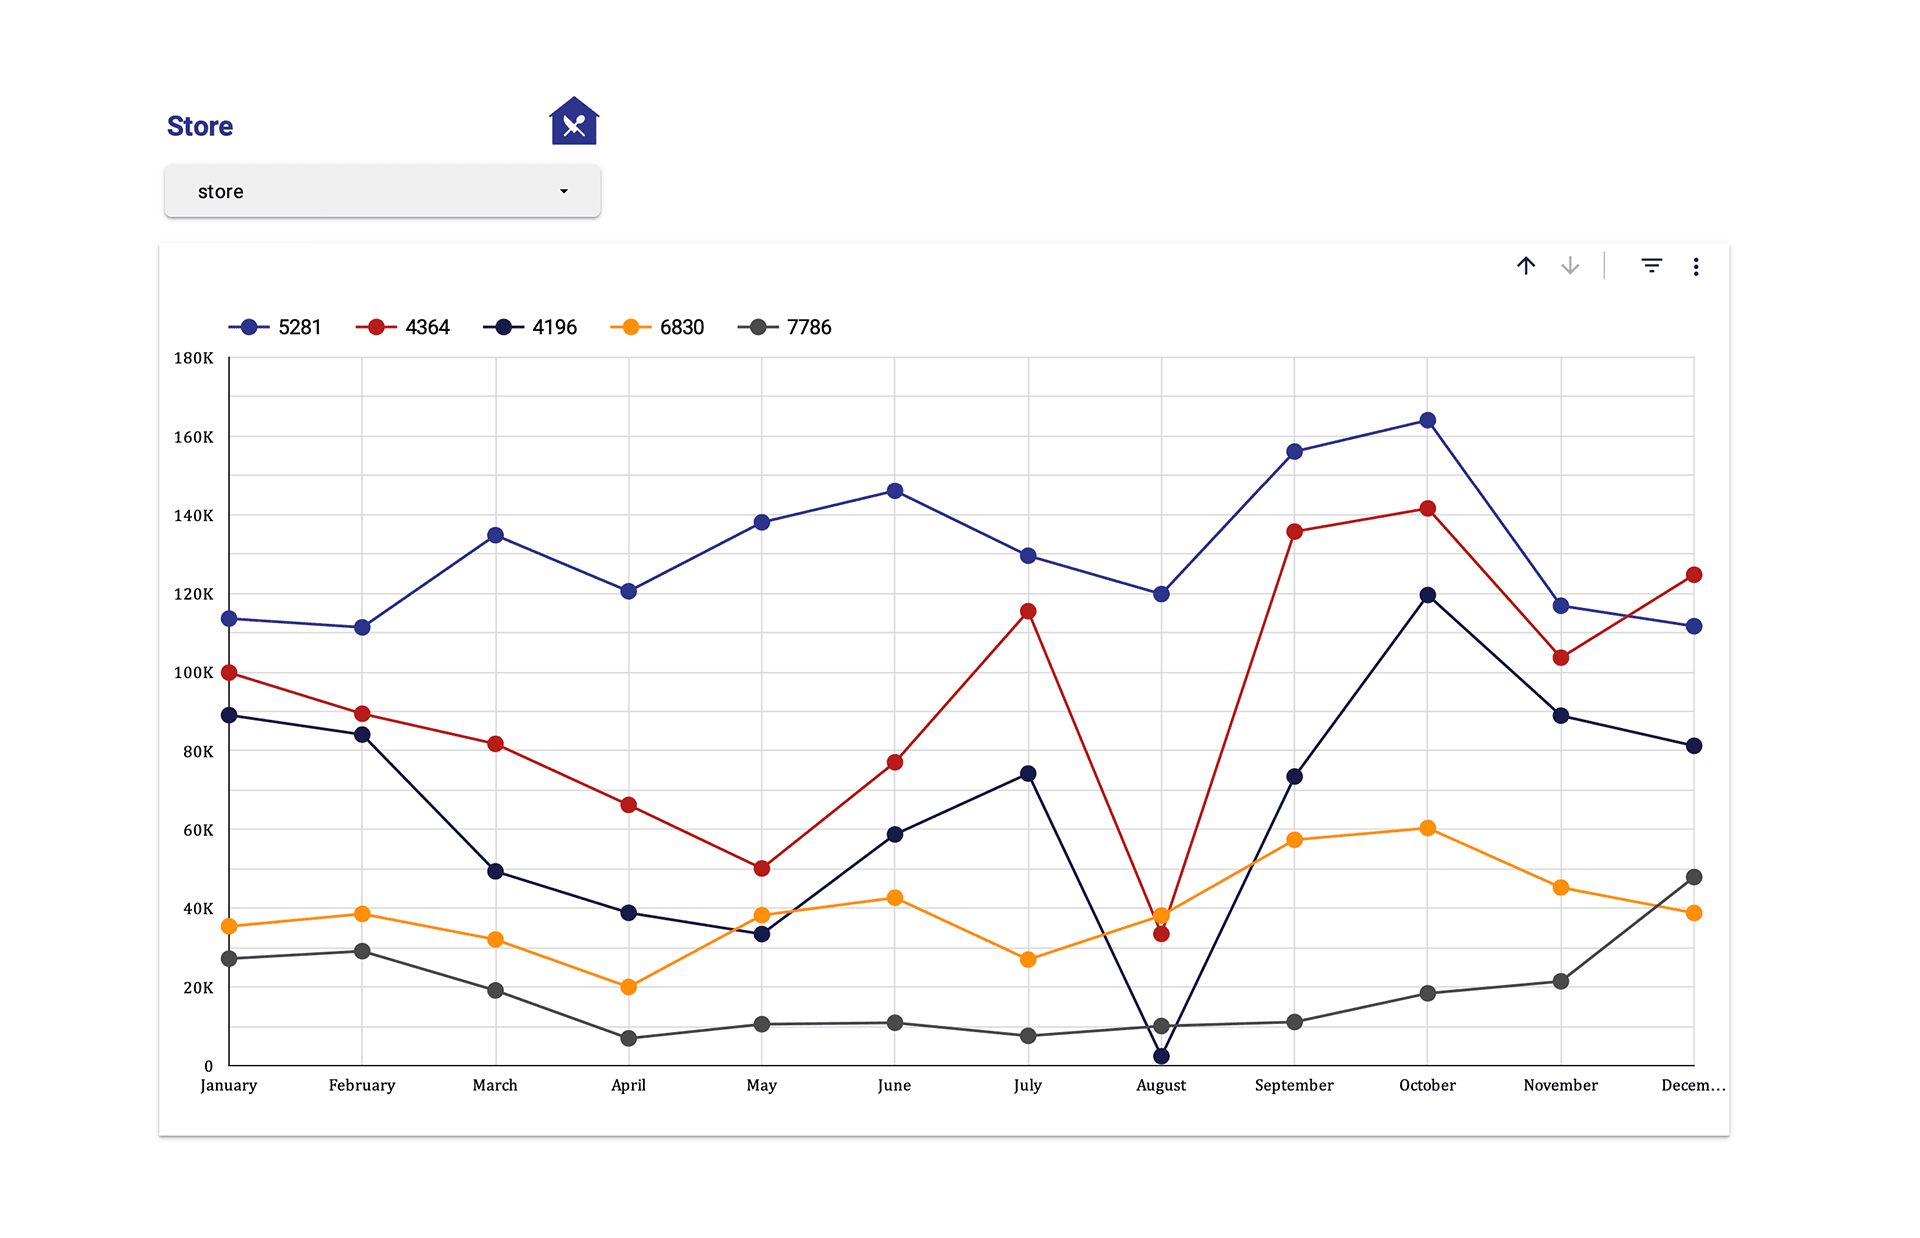
Data visualization: created interactive dashboards using Looker to present actionable insights.
Statistical analysis & forecasting: applied statistical methods to predict trends like peak hours, popular menu items, and revenue forecasts.
Business impact analysis: measured how data-driven decisions could improve profitability and customer satisfaction.
Tools
Python (Pandas, NumPy, Matplotlib, Seabo)
SQL for data extraction and exploration
Looker for visualizations
03
Outcome
Improved restaurant decision-making by identifying sales patterns and optimizing resource allocation.
Demonstrated how analytics can increase efficiency and profitability for food service businesses.
Presented complex insights through user-friendly dashboards and visual storytelling.
Why it matters
Restaurants face challenges every day—high competition, changing customer demands, and fluctuating costs. By leveraging data analytics, businesses can stay ahead of the curve and operate smarter.


